
Formula#
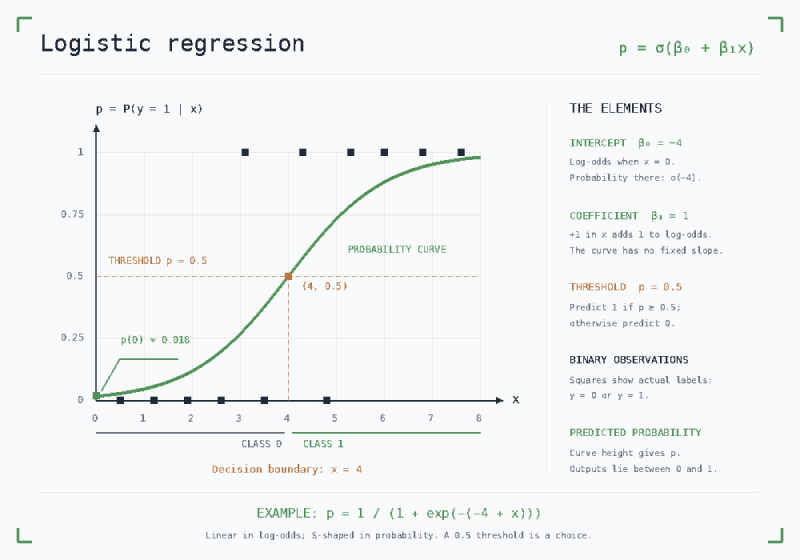
Taking as a reference the Linear Regression, in Logistic Regression the linear output is converted into a probability between 0 and 1 using the sigmoid function:
$$\sigma(z) = \frac{1}{1 + e^{-z}}$$With \(z = \beta_0 + X\beta\) as the linear score, the model’s predicted probability is \(\hat{p} = \sigma(z) = \sigma(\beta_0 + X\beta) = \frac{1}{1 + e^{-(\beta_0 + X\beta)}}\).
Estimation framework#
To find the optimal parameters and minimize the loss, instead of using residuals like linear regression, logistic regression typically relies on Maximum Likelihood Estimation (MLE) to maximize the negative loss function.
Loss function#
The loss function for logistic regression is commonly the log-loss (or negative log-likelihood function). This is equivalent to cross-entropy loss. When multiple classes are involved, softmax regression is a common technique to generalize logistic regression.
Optimization#
Similar the linear regression, logistic regression can use gradient descent to perform the parameters optimization and minimize the loss function. It can also use Newton-Raphson.
Evaluation#
To evaluate logistic regression we use the typical classification metrics.
Pitfalls#
Logistic regression does not work well under some circumstances:
- given its relative simplicity, it is a high biases and low variance model, so it may perform badly when the decision boundary is not linear
- when features are highly correlated, the coefficients \(\beta\) won’t be as accurate
Similar to Linear Regression, techniques like regularization, removal of features, etc. can be used to address the pitfalls.